Environment
Is California water use increasing?
Produced by Aaron Mendelson & Chris Keller | Updated Sept. 7, 2016
Sources: California Water Resources Control Board. Built using: django-bakery, underscore.js, backbone.js, leaflet.js, chartist.js & Bootstrap. Circles on a line distribution charts based on CensusReporter charts, design and code created by Ryan Pitts, Joe Germuska, Ian Dees and Sara Schnadt. Icon credits: Waste icon created by Luis Prado and licensed under the Creative Commons Attribution from The Noun Project. Washing Machine icon created by Megan Sheehan and licensed under the Creative Commons Attribution from The Noun Project. Bucket icon created by Nithin Viswanathan and licensed under the Creative Commons Attribution from The Noun Project. Water drop icon created by Diego Naive and licensed under the Creative Commons Attribution from The Noun Project. Broom icon created by Anna Weiss and licensed under the Creative Commons Attribution from The Noun Project. Clock icon created by Pavel Nikandrov and used via a Public Domain Mark from The Noun Project. Sprinkler icon created by Micah West and licensed under the Creative Commons Attribution from The Noun Project. Cactus icon created by Edward Boatman and licensed under the Creative Commons Attribution from The Noun Project. Shower icon used via a Public Domain Mark from The Noun Project.
Choose a water supplier
About the data: These charts show the daily per capita residential water use rate in California as calculated by the State Water Resources Control Board. The charts cover the August 2017 reporting period, and are compared to the previous month unless specified. Since the per capita measure (which reflects gallons of water used per resident per day) does not take into account rainfall, temperature, humidity and population density, the State Water Resources Control Board discourages comparisons between water suppliers.
Central Coast
For the 31 agencies in this region the average daily water consumption by each residential customer decreased to 49.76 gallons in August 2017 compared to 52.36 gallons in July 2017.
-
City Of Santa Cruz
33.80
residential gallons
used daily per capita -
Goleta Water District
37.20
residential gallons
used daily per capita -
California Water Service Company King City
37.60
residential gallons
used daily per capita -
Cambria Community Services District
41.30
residential gallons
used daily per capita -
Soquel Creek Water District
41.80
residential gallons
used daily per capita -
City Of San Luis Obispo
43.90
residential gallons
used daily per capita -
California Water Service Company Salinas District
44.80
residential gallons
used daily per capita -
City Of Watsonville
44.90
residential gallons
used daily per capita -
City Of Santa Maria
47.80
residential gallons
used daily per capita -
City Of Lompoc
49.00
residential gallons
used daily per capita -
City Of Morro Bay
49.30
residential gallons
used daily per capita -
City Of Greenfield
49.40
residential gallons
used daily per capita -
California-American Water Company Monterey District
50.30
residential gallons
used daily per capita -
Marina Coast Water District
50.80
residential gallons
used daily per capita -
City Of Gilroy
52.60
residential gallons
used daily per capita -
Sunnyslope County Water District
52.90
residential gallons
used daily per capita -
City Of Grover Beach
53.10
residential gallons
used daily per capita -
City Of Morgan Hill
54.40
residential gallons
used daily per capita -
City Of Soledad
55.00
residential gallons
used daily per capita -
City Of Santa Barbara
55.50
residential gallons
used daily per capita -
City Of Arroyo Grande
55.60
residential gallons
used daily per capita -
Atascadero Mutual Water Company
55.90
residential gallons
used daily per capita -
Scotts Valley Water District
56.00
residential gallons
used daily per capita -
City Of Pismo Beach
59.30
residential gallons
used daily per capita -
City Of Hollister
59.50
residential gallons
used daily per capita -
City Of Paso Robles
60.60
residential gallons
used daily per capita -
Carpinteria Valley Water District
64.20
residential gallons
used daily per capita -
Nipomo Community Services District
71.00
residential gallons
used daily per capita -
Alco Water Service
77.20
residential gallons
used daily per capita -
Golden State Water Company Orcutt
83.30
residential gallons
used daily per capita -
Montecito Water District
88.60
residential gallons
used daily per capita -
Min
33.80 -
Median
53.10 -
Average
49.76 -
Max
88.60
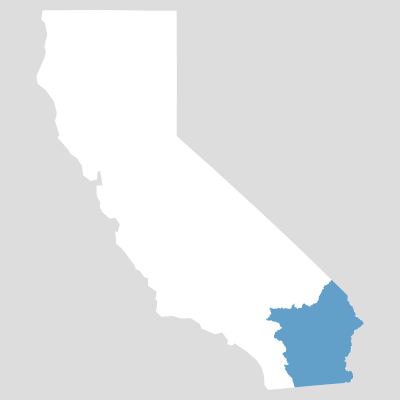
Colorado River
For the 15 agencies in this region the average daily water consumption by each residential customer increased to 114.56 gallons in August 2017 compared to 111.52 gallons in July 2017.
-
Hi-Desert Water District
57.30
residential gallons
used daily per capita -
City Of Coachella
67.70
residential gallons
used daily per capita -
City Of Blythe
67.90
residential gallons
used daily per capita -
Joshua Basin Water District
71.40
residential gallons
used daily per capita -
City Of Banning
74.10
residential gallons
used daily per capita -
City Of Imperial
76.30
residential gallons
used daily per capita -
City Of El Centro
77.80
residential gallons
used daily per capita -
Twentynine Palms Water District
80.70
residential gallons
used daily per capita -
City Of Calexico
88.20
residential gallons
used daily per capita -
City Of Brawley
94.20
residential gallons
used daily per capita -
City Of Indio
94.50
residential gallons
used daily per capita -
Mission Springs Water District
94.70
residential gallons
used daily per capita -
Desert Water Agency
122.90
residential gallons
used daily per capita -
Coachella Valley Water District
154.80
residential gallons
used daily per capita -
Myoma Dunes Mutual Water Company
170.80
residential gallons
used daily per capita -
Min
57.30 -
Median
88.20 -
Average
114.56 -
Max
170.80
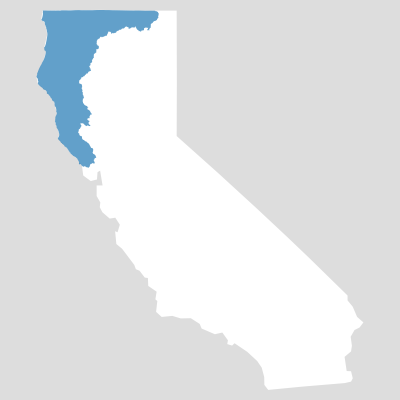
North Coast
For the 15 agencies in this region the average daily water consumption by each residential customer decreased to 51.95 gallons in August 2017 compared to 52.47 gallons in July 2017.
-
City Of Ukiah
39.90
residential gallons
used daily per capita -
City Of Arcata
40.20
residential gallons
used daily per capita -
Town Of Windsor
44.50
residential gallons
used daily per capita -
Humboldt Community Service District
45.30
residential gallons
used daily per capita -
City Of Rohnert Park
46.70
residential gallons
used daily per capita -
Mckinleyville Community Service District
49.80
residential gallons
used daily per capita -
City Of Santa Rosa
54.30
residential gallons
used daily per capita -
City Of Healdsburg
55.10
residential gallons
used daily per capita -
Humboldt Bay Municipal Water District
57.20
residential gallons
used daily per capita -
City Of Yreka
57.30
residential gallons
used daily per capita -
City Of Eureka
57.80
residential gallons
used daily per capita -
Sweetwater Springs Water District
57.90
residential gallons
used daily per capita -
City Of Crescent City
60.30
residential gallons
used daily per capita -
City Of Fortuna
63.80
residential gallons
used daily per capita -
California Water Service Company Redwood Valley
68.10
residential gallons
used daily per capita -
Min
39.90 -
Median
57.20 -
Average
51.95 -
Max
68.10
North Lahontan
For the 5 agencies in this region the average daily water consumption by each residential customer decreased to 59.13 gallons in August 2017 compared to 61.57 gallons in July 2017.
-
Tahoe City Public Utilities District
35.40
residential gallons
used daily per capita -
South Tahoe Public Utilities District
53.00
residential gallons
used daily per capita -
Truckee-Donner Public Utilities District
56.50
residential gallons
used daily per capita -
North Tahoe Public Utility District
66.20
residential gallons
used daily per capita -
City Of Susanville
105.70
residential gallons
used daily per capita -
Min
35.40 -
Median
66.20 -
Average
59.13 -
Max
105.70
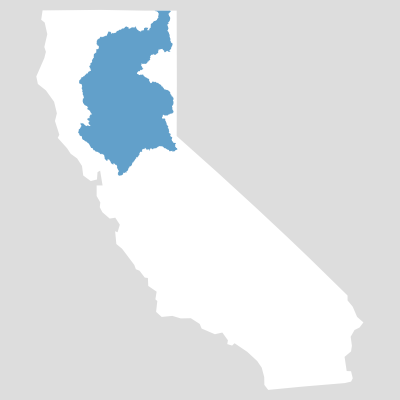
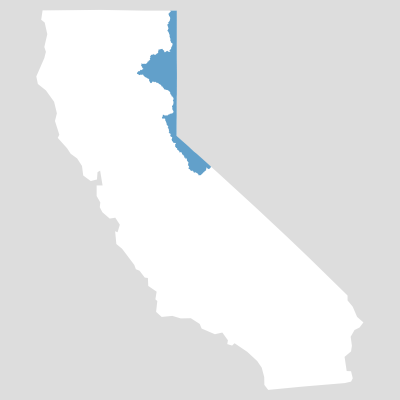
Sacramento River
For the 42 agencies in this region the average daily water consumption by each residential customer increased to 68.92 gallons in August 2017 compared to 68.41 gallons in July 2017.
-
City Of Woodland
52.40
residential gallons
used daily per capita -
City Of Roseville
52.50
residential gallons
used daily per capita -
Bella Vista Water District
54.10
residential gallons
used daily per capita -
Del Oro Water Company
54.10
residential gallons
used daily per capita -
Elk Grove Water Service
54.30
residential gallons
used daily per capita -
California-American Water Company Sacramento District
55.90
residential gallons
used daily per capita -
City Of Fairfield
56.30
residential gallons
used daily per capita -
City Of Davis
57.10
residential gallons
used daily per capita -
California Water Service Company Oroville
57.40
residential gallons
used daily per capita -
City Of Lincoln
57.90
residential gallons
used daily per capita -
City Of Anderson
58.30
residential gallons
used daily per capita -
California Water Service Company Willows
60.50
residential gallons
used daily per capita -
Nevada Irrigation District
61.20
residential gallons
used daily per capita -
City Of Vacaville
63.20
residential gallons
used daily per capita -
City Of California Water Service Company Dixon
63.30
residential gallons
used daily per capita -
Sacramento Suburban Water District
63.50
residential gallons
used daily per capita -
California Water Service Company Chico District
65.20
residential gallons
used daily per capita -
City Of Yuba City
66.20
residential gallons
used daily per capita -
California Water Service Company Marysville
66.30
residential gallons
used daily per capita -
City Of Sacramento
66.40
residential gallons
used daily per capita -
Sacramento County Water Agency
69.80
residential gallons
used daily per capita -
City Of Galt
71.50
residential gallons
used daily per capita -
City Of Redding
71.60
residential gallons
used daily per capita -
Orange Vale Water Company
72.00
residential gallons
used daily per capita -
City Of Red Bluff
75.20
residential gallons
used daily per capita -
El Dorado Irrigation District
77.10
residential gallons
used daily per capita -
Fair Oaks Water District
77.40
residential gallons
used daily per capita -
City Of Rio Vista
77.80
residential gallons
used daily per capita -
Citrus Heights Water District
79.60
residential gallons
used daily per capita -
Olivehurst Public Utility District
80.70
residential gallons
used daily per capita -
Placer County Water Agency
82.40
residential gallons
used daily per capita -
City Of West Sacramento
84.30
residential gallons
used daily per capita -
Carmichael Water District
86.60
residential gallons
used daily per capita -
Rio Linda - Elverta Community Water District
89.40
residential gallons
used daily per capita -
San Juan Water District
91.30
residential gallons
used daily per capita -
Georgetown Divide Public Utilities District
91.30
residential gallons
used daily per capita -
Linda County Water District
91.60
residential gallons
used daily per capita -
Paradise Irrigation District
95.60
residential gallons
used daily per capita -
Fruitridge Vista Water Company
100.40
residential gallons
used daily per capita -
City Of Folsom
101.70
residential gallons
used daily per capita -
Golden State Water Company Cordova
108.70
residential gallons
used daily per capita -
South Feather Water And Power Agency
135.40
residential gallons
used daily per capita -
Min
52.40 -
Median
71.50 -
Average
68.92 -
Max
135.40
San Francisco Bay
For the 46 agencies in this region the average daily water consumption by each residential customer increased to 50.62 gallons in August 2017 compared to 50.58 gallons in July 2017.
-
City Of Martinez
29.90
residential gallons
used daily per capita -
California Water Service Company South San Francisco
37.90
residential gallons
used daily per capita -
City Of San Bruno
38.40
residential gallons
used daily per capita -
San Francisco Public Utilities Commission
40.60
residential gallons
used daily per capita -
City Of East Palo Alto
40.60
residential gallons
used daily per capita -
City Of Hayward
41.80
residential gallons
used daily per capita -
North Coast County Water District
44.90
residential gallons
used daily per capita -
Great Oaks Water Company Incorporated
45.80
residential gallons
used daily per capita -
Westborough Water District
45.90
residential gallons
used daily per capita -
California Water Service Company Mid Peninsula
46.00
residential gallons
used daily per capita -
Valley Of The Moon Water District
47.70
residential gallons
used daily per capita -
Golden State Water Company Bay Point
47.80
residential gallons
used daily per capita -
City Of Menlo Park
47.90
residential gallons
used daily per capita -
City Of Redwood City
47.90
residential gallons
used daily per capita -
San Jose Water Company
49.00
residential gallons
used daily per capita -
City Of American Canyon
49.60
residential gallons
used daily per capita -
City Of Sunnyvale
49.90
residential gallons
used daily per capita -
City Of Milpitas
50.30
residential gallons
used daily per capita -
City Of Palo Alto
50.60
residential gallons
used daily per capita -
City Of Santa Clara
51.00
residential gallons
used daily per capita -
City Of Napa
51.10
residential gallons
used daily per capita -
Estero Municipal Improvement District
51.70
residential gallons
used daily per capita -
City Of Mountain View
51.90
residential gallons
used daily per capita -
City Of Millbrae
52.00
residential gallons
used daily per capita -
City Of Benicia
52.90
residential gallons
used daily per capita -
California Water Service Company Livermore
53.10
residential gallons
used daily per capita -
Alameda County Water District
53.20
residential gallons
used daily per capita -
California Water Service Company Bear Gulch
53.20
residential gallons
used daily per capita -
City Of Daly City
53.40
residential gallons
used daily per capita -
City Of Petaluma
53.60
residential gallons
used daily per capita -
East Bay Municipal Utilities District
53.80
residential gallons
used daily per capita -
City Of Burlingame
54.20
residential gallons
used daily per capita -
City Of Pleasanton
55.40
residential gallons
used daily per capita -
Contra Costa Water District
57.80
residential gallons
used daily per capita -
Mid-Peninsula Water District
57.90
residential gallons
used daily per capita -
California Water Service Company Los Altos Suburban
58.00
residential gallons
used daily per capita -
City Of Livermore
58.20
residential gallons
used daily per capita -
Marin Municipal Water District
58.30
residential gallons
used daily per capita -
Coastside County Water District
60.00
residential gallons
used daily per capita -
Dublin San Ramon Services District
60.50
residential gallons
used daily per capita -
City Of San Jose
62.90
residential gallons
used daily per capita -
City Of Pittsburg
63.20
residential gallons
used daily per capita -
City Of Sonoma
65.50
residential gallons
used daily per capita -
Town Of Hillsborough
71.60
residential gallons
used daily per capita -
North Marin Water District
76.00
residential gallons
used daily per capita -
Min
29.90 -
Median
52.00 -
Average
50.62 -
Max
76.00
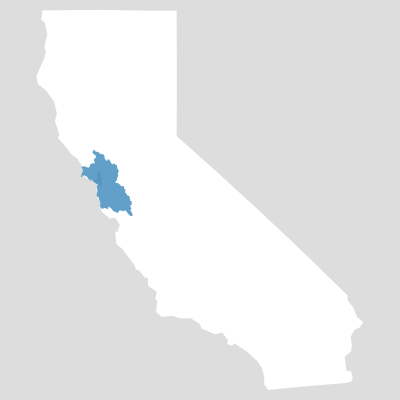
San Joaquin River
For the 25 agencies in this region the average daily water consumption by each residential customer decreased to 64.67 gallons in August 2017 compared to 66.38 gallons in July 2017.
-
City Of Patterson
30.30
residential gallons
used daily per capita -
Amador Water Agency
40.60
residential gallons
used daily per capita -
City Of Lathrop
45.20
residential gallons
used daily per capita -
California Water Service Company Stockton
48.50
residential gallons
used daily per capita -
Diablo Water District
52.20
residential gallons
used daily per capita -
City Of Ceres
56.10
residential gallons
used daily per capita -
City Of Stockton
56.60
residential gallons
used daily per capita -
City Of Livingston
56.80
residential gallons
used daily per capita -
City Of Madera
59.80
residential gallons
used daily per capita -
City Of Manteca
60.10
residential gallons
used daily per capita -
Tuolumne Utilities District
61.00
residential gallons
used daily per capita -
City Of Antioch
61.30
residential gallons
used daily per capita -
City Of Lodi
61.80
residential gallons
used daily per capita -
City Of Brentwood
63.00
residential gallons
used daily per capita -
Calaveras County Water District
64.90
residential gallons
used daily per capita -
City Of Tracy
70.80
residential gallons
used daily per capita -
City Of Los Banos
72.10
residential gallons
used daily per capita -
City Of Oakdale
74.50
residential gallons
used daily per capita -
City Of Ripon
75.30
residential gallons
used daily per capita -
City Of Turlock
76.00
residential gallons
used daily per capita -
Groveland Community Services District
78.10
residential gallons
used daily per capita -
City Of Modesto
79.70
residential gallons
used daily per capita -
City Of Atwater
86.40
residential gallons
used daily per capita -
Discovery Bay Community Services District
86.50
residential gallons
used daily per capita -
City Of Merced
88.50
residential gallons
used daily per capita -
Min
30.30 -
Median
63.00 -
Average
64.67 -
Max
88.50
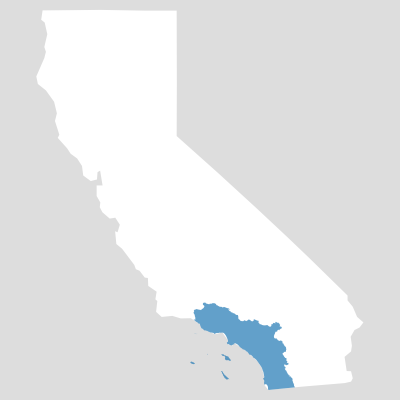
South Coast
For the 173 agencies in this region the average daily water consumption by each residential customer decreased to 65.87 gallons in August 2017 compared to 69.63 gallons in July 2017.
-
City Of Lynwood
33.30
residential gallons
used daily per capita -
City Of El Monte
33.50
residential gallons
used daily per capita -
Fallbrook Public Utility District
35.20
residential gallons
used daily per capita -
City Of Huntington Park
35.30
residential gallons
used daily per capita -
California Water Service Company East Los Angeles
37.40
residential gallons
used daily per capita -
City Of Fountain Valley
38.50
residential gallons
used daily per capita -
Park Water Company
39.80
residential gallons
used daily per capita -
City Of Seal Beach
42.80
residential gallons
used daily per capita -
City Of Vernon
43.20
residential gallons
used daily per capita -
Golden State Water Company Florence Graham
46.40
residential gallons
used daily per capita -
City Of San Diego
46.80
residential gallons
used daily per capita -
Golden State Water Company Bell-Bell Gardens
47.00
residential gallons
used daily per capita -
City Of Oxnard
47.50
residential gallons
used daily per capita -
City Of Big Bear Lake Dept Of Water Power
49.10
residential gallons
used daily per capita -
City Of Port Hueneme
49.50
residential gallons
used daily per capita -
City Of South Gate
50.00
residential gallons
used daily per capita -
City Of Compton
50.80
residential gallons
used daily per capita -
City Of Santa Ana
51.50
residential gallons
used daily per capita -
City Of La Palma
52.30
residential gallons
used daily per capita -
Golden State Water Company Norwalk
53.00
residential gallons
used daily per capita -
Padre Dam Municipal Water District
54.00
residential gallons
used daily per capita -
California-American Water Company San Diego District
54.40
residential gallons
used daily per capita -
San Gabriel Valley Water Company
54.40
residential gallons
used daily per capita -
City Of Paramount
54.50
residential gallons
used daily per capita -
Golden State Water Company Southwest
54.70
residential gallons
used daily per capita -
City Of Oceanside
55.30
residential gallons
used daily per capita -
Orchard Dale Water District
56.10
residential gallons
used daily per capita -
City Of Inglewood
57.00
residential gallons
used daily per capita -
California Water Service Company Dominguez
57.10
residential gallons
used daily per capita -
City Of Pico Rivera
57.20
residential gallons
used daily per capita -
City Of Santa Fe Springs
57.50
residential gallons
used daily per capita -
Montebello Land And Water Company
57.50
residential gallons
used daily per capita -
Lakeside Water District
57.60
residential gallons
used daily per capita -
City Of Hawthorne
57.70
residential gallons
used daily per capita -
Golden State Water Company S San Gabriel
57.90
residential gallons
used daily per capita -
Otay Water District
58.20
residential gallons
used daily per capita -
Valley County Water District
58.50
residential gallons
used daily per capita -
Vallecitos Water District
58.80
residential gallons
used daily per capita -
Los Angeles Department Of Water And Power
59.30
residential gallons
used daily per capita -
Vista Irrigation District
60.00
residential gallons
used daily per capita -
Golden State Water Company Artesia
60.00
residential gallons
used daily per capita -
City Of Hemet
60.30
residential gallons
used daily per capita -
Golden State Water Company Culver City
60.30
residential gallons
used daily per capita -
City Of Long Beach
60.80
residential gallons
used daily per capita -
Rubidoux Community Service District
61.30
residential gallons
used daily per capita -
City Of Garden Grove
61.60
residential gallons
used daily per capita -
City Of Escondido
61.90
residential gallons
used daily per capita -
Suburban Water Systems San Jose Hills
62.20
residential gallons
used daily per capita -
Helix Water District
62.30
residential gallons
used daily per capita -
City Of Anaheim
62.40
residential gallons
used daily per capita -
City Of Buena Park
62.50
residential gallons
used daily per capita -
Rowland Water District
62.70
residential gallons
used daily per capita -
California Water Service Company Hermosa Redondo
62.70
residential gallons
used daily per capita -
Monte Vista Water District
62.80
residential gallons
used daily per capita -
City Of Lakewood
62.90
residential gallons
used daily per capita -
City Of Santa Monica
63.10
residential gallons
used daily per capita -
Eastern Municipal Water District
63.50
residential gallons
used daily per capita -
Elsinore Valley Municipal Water District
63.70
residential gallons
used daily per capita -
Irvine Ranch Water District
64.00
residential gallons
used daily per capita -
Rincon Del Diablo Municipal Water District
65.30
residential gallons
used daily per capita -
City Of Azusa
65.70
residential gallons
used daily per capita -
City Of Monterey Park
65.90
residential gallons
used daily per capita -
El Toro Water District
66.10
residential gallons
used daily per capita -
Sunny Slope Water Company
66.50
residential gallons
used daily per capita -
City Of Downey
66.70
residential gallons
used daily per capita -
Mesa Water District
66.90
residential gallons
used daily per capita -
Bellflower-Somerset Mutual Water Company
67.00
residential gallons
used daily per capita -
San Gabriel County Water District
67.40
residential gallons
used daily per capita -
City Of Lomita
67.50
residential gallons
used daily per capita -
Casitas Municipal Water District
67.70
residential gallons
used daily per capita -
City Of Camarillo
68.00
residential gallons
used daily per capita -
Golden State Water Company Placentia
68.20
residential gallons
used daily per capita -
City Of Ontario
68.60
residential gallons
used daily per capita -
City Of Pomona
68.70
residential gallons
used daily per capita -
City Of Whittier
69.20
residential gallons
used daily per capita -
Golden State Water Company West Orange
69.40
residential gallons
used daily per capita -
City Of La Habra
69.40
residential gallons
used daily per capita -
City Of Torrance
69.50
residential gallons
used daily per capita -
Lincoln Avenue Water Company
69.60
residential gallons
used daily per capita -
Golden State Water Company Simi Valley
69.90
residential gallons
used daily per capita -
Golden State Water Company S Arcadia
70.20
residential gallons
used daily per capita -
City Of Rialto
70.40
residential gallons
used daily per capita -
San Gabriel Valley Fontana Water Company
70.60
residential gallons
used daily per capita -
City Of Perris
70.70
residential gallons
used daily per capita -
Rainbow Municipal Water District
71.00
residential gallons
used daily per capita -
City Of Huntington Beach
71.10
residential gallons
used daily per capita -
City Of San Fernando
71.20
residential gallons
used daily per capita -
City Of Chino
71.40
residential gallons
used daily per capita -
City Of San Jacinto
71.40
residential gallons
used daily per capita -
City Of Riverside
71.40
residential gallons
used daily per capita -
City Of Manhattan Beach
71.80
residential gallons
used daily per capita -
City Of Westminster
72.20
residential gallons
used daily per capita -
City Of Glendale
72.30
residential gallons
used daily per capita -
Ramona Municipal Water District
72.40
residential gallons
used daily per capita -
City Of Colton
72.50
residential gallons
used daily per capita -
City Of Poway
72.50
residential gallons
used daily per capita -
Santa Margarita Water District
72.80
residential gallons
used daily per capita -
Moulton Niguel Water District
72.90
residential gallons
used daily per capita -
City Of San Clemente
73.00
residential gallons
used daily per capita -
Valencia Water Company
73.10
residential gallons
used daily per capita -
City Of Alhambra
73.80
residential gallons
used daily per capita -
Carlsbad Municipal Water District
73.90
residential gallons
used daily per capita -
Western Municipal Water District Of Riverside
74.20
residential gallons
used daily per capita -
Lake Hemet Municipal Water District
74.50
residential gallons
used daily per capita -
Pico Water District
74.50
residential gallons
used daily per capita -
City Of San Juan Capistrano
76.30
residential gallons
used daily per capita -
City Of South Pasadena
77.00
residential gallons
used daily per capita -
City Of Thousand Oaks
77.10
residential gallons
used daily per capita -
City Of Covina
77.30
residential gallons
used daily per capita -
City Of El Segundo
77.60
residential gallons
used daily per capita -
San Dieguito Water District
77.80
residential gallons
used daily per capita -
City Of Orange
78.10
residential gallons
used daily per capita -
City Of San Bernardino
78.70
residential gallons
used daily per capita -
Ventura County Waterworks District No 8
78.80
residential gallons
used daily per capita -
Suburban Water Systems Whittier La Mirada
78.90
residential gallons
used daily per capita -
City Of Chino Hills
79.00
residential gallons
used daily per capita -
South Coast Water District
79.00
residential gallons
used daily per capita -
City Of Fullerton
79.40
residential gallons
used daily per capita -
Golden State Water Company San Dimas
79.90
residential gallons
used daily per capita -
City Of Pasadena
80.10
residential gallons
used daily per capita -
Crescenta Valley Water District
80.90
residential gallons
used daily per capita -
City Of Fillmore
82.90
residential gallons
used daily per capita -
City Of Burbank
82.90
residential gallons
used daily per capita -
East Valley Water District
83.00
residential gallons
used daily per capita -
City Of Brea
83.40
residential gallons
used daily per capita -
Laguna Beach County Water District
83.60
residential gallons
used daily per capita -
City Of Monrovia
84.70
residential gallons
used daily per capita -
City Of Norwalk
85.30
residential gallons
used daily per capita -
Castaic Lake Water Agency Santa Clarita Water Division
85.50
residential gallons
used daily per capita -
City Of Loma Linda
86.10
residential gallons
used daily per capita -
Valley Center Municipal Water District
86.60
residential gallons
used daily per capita -
Camrosa Water District
87.90
residential gallons
used daily per capita -
Walnut Valley Water District
87.90
residential gallons
used daily per capita -
Trabuco Canyon Water District
88.60
residential gallons
used daily per capita -
Newhall County Water District
88.60
residential gallons
used daily per capita -
Jurupa Community Service District
89.00
residential gallons
used daily per capita -
City Of Santa Paula
89.80
residential gallons
used daily per capita -
City Of Cerritos
90.30
residential gallons
used daily per capita -
Ventura County Waterworks District No 1
90.50
residential gallons
used daily per capita -
Olivenhain Municipal Water District
90.80
residential gallons
used daily per capita -
Lee Lake Water District
91.00
residential gallons
used daily per capita -
West Valley Water District
91.40
residential gallons
used daily per capita -
Las Virgenes Municipal Water District
91.50
residential gallons
used daily per capita -
City Of Corona
93.10
residential gallons
used daily per capita -
California-American Water Ventura District
93.30
residential gallons
used daily per capita -
Golden State Water Company Claremont
94.20
residential gallons
used daily per capita -
City Of Tustin
94.50
residential gallons
used daily per capita -
City Of Upland
94.80
residential gallons
used daily per capita -
Cucamonga Valley Water District
95.00
residential gallons
used daily per capita -
Triunfo Sanitation District Oak Park Water Service
95.20
residential gallons
used daily per capita -
City Of La Verne
95.30
residential gallons
used daily per capita -
City Of Redlands
97.20
residential gallons
used daily per capita -
City Of Glendora
97.30
residential gallons
used daily per capita -
City Of Newport Beach
99.70
residential gallons
used daily per capita -
Beaumont-Cherry Valley Water District
101.80
residential gallons
used daily per capita -
California-American Water Company Los Angeles District
104.50
residential gallons
used daily per capita -
Yucaipa Valley Water District
105.50
residential gallons
used daily per capita -
City Of Beverly Hills
108.50
residential gallons
used daily per capita -
City Of Norco
108.60
residential gallons
used daily per capita -
Rancho California Water District
109.90
residential gallons
used daily per capita -
Riverside Highland Water Company
110.40
residential gallons
used daily per capita -
Rubio Canyon Land And Water Association
112.10
residential gallons
used daily per capita -
City Of Sierra Madre
119.90
residential gallons
used daily per capita -
California Water Service Company Palos Verdes
121.20
residential gallons
used daily per capita -
Yorba Linda Water District
125.90
residential gallons
used daily per capita -
East Orange County Water District
131.30
residential gallons
used daily per capita -
City Of Arcadia
133.30
residential gallons
used daily per capita -
California Water Service Company Westlake
138.60
residential gallons
used daily per capita -
Valley Water Company
164.30
residential gallons
used daily per capita -
Los Angeles County Public Works Waterworks District 29
190.90
residential gallons
used daily per capita -
Santa Fe Irrigation District
210.50
residential gallons
used daily per capita -
Min
33.30 -
Median
71.10 -
Average
65.87 -
Max
210.50
South Lahontan
For the 17 agencies in this region the average daily water consumption by each residential customer increased to 73.97 gallons in August 2017 compared to 73.89 gallons in July 2017.
-
Lake Arrowhead Community Services District
23.40
residential gallons
used daily per capita -
Mammoth Community Water District
42.10
residential gallons
used daily per capita -
Crestline Village Water District
44.60
residential gallons
used daily per capita -
Phelan Pinon Hills Community Services District
56.00
residential gallons
used daily per capita -
San Bernardino County Service Area 64
58.40
residential gallons
used daily per capita -
City Of Adelanto
59.60
residential gallons
used daily per capita -
Apple Valley Ranchos Water Company
60.60
residential gallons
used daily per capita -
Golden State Water Company Barstow
70.10
residential gallons
used daily per capita -
City Of California City
70.50
residential gallons
used daily per capita -
City Of Hesperia Water District
72.10
residential gallons
used daily per capita -
Rosamond Community Service District
72.40
residential gallons
used daily per capita -
Victorville Water District
73.90
residential gallons
used daily per capita -
Palmdale Water District
74.70
residential gallons
used daily per capita -
California Water Service Company Antelope Valley
87.00
residential gallons
used daily per capita -
Los Angeles County Public Works Waterworks District 40
88.10
residential gallons
used daily per capita -
Quartz Hill Water District
95.20
residential gallons
used daily per capita -
Indian Wells Valley Water District
101.30
residential gallons
used daily per capita -
Min
23.40 -
Median
72.10 -
Average
73.97 -
Max
101.30
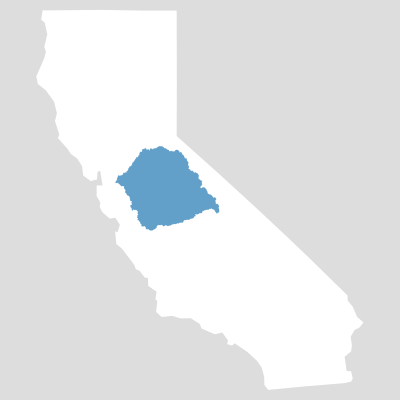
Tulare Lake
For the 28 agencies in this region the average daily water consumption by each residential customer increased to 81.85 gallons in August 2017 compared to 76.28 gallons in July 2017.
-
City Of Reedley
39.90
residential gallons
used daily per capita -
City Of Delano
45.70
residential gallons
used daily per capita -
City Of Wasco
47.20
residential gallons
used daily per capita -
City Of Lemoore
48.30
residential gallons
used daily per capita -
Arvin Community Services District
49.70
residential gallons
used daily per capita -
California Water Service Company Selma
62.80
residential gallons
used daily per capita -
City Of Kerman
63.90
residential gallons
used daily per capita -
City Of Tulare
64.70
residential gallons
used daily per capita -
West Kern Water District
67.90
residential gallons
used daily per capita -
Pinedale County Water District
69.10
residential gallons
used daily per capita -
City Of Hanford
69.30
residential gallons
used daily per capita -
City Of Dinuba
69.30
residential gallons
used daily per capita -
City Of Porterville
69.30
residential gallons
used daily per capita -
City Of Exeter
69.90
residential gallons
used daily per capita -
City Of Tehachapi
70.10
residential gallons
used daily per capita -
California Water Service Company Visalia
72.50
residential gallons
used daily per capita -
Lamont Public Utility District
72.60
residential gallons
used daily per capita -
City Of Clovis
72.60
residential gallons
used daily per capita -
California Water Service Company Kern River Valley
74.80
residential gallons
used daily per capita -
California Water Service Company Bakersfield
82.30
residential gallons
used daily per capita -
City Of Fresno
83.80
residential gallons
used daily per capita -
Bakman Water Company
89.30
residential gallons
used daily per capita -
City Of Kingsburg
103.00
residential gallons
used daily per capita -
Oildale Mutual Water Company
103.50
residential gallons
used daily per capita -
City Of Shafter
106.70
residential gallons
used daily per capita -
East Niles Community Service District
107.60
residential gallons
used daily per capita -
City Of Bakersfield
129.10
residential gallons
used daily per capita -
Vaughn Water Company
155.20
residential gallons
used daily per capita -
Min
39.90 -
Median
70.10 -
Average
81.85 -
Max
155.20