Environment
Is California water use increasing?
Produced by Aaron Mendelson & Chris Keller | Updated Sept. 7, 2016
Sources: California Water Resources Control Board. Built using: django-bakery, underscore.js, backbone.js, leaflet.js, chartist.js & Bootstrap. Circles on a line distribution charts based on CensusReporter charts, design and code created by Ryan Pitts, Joe Germuska, Ian Dees and Sara Schnadt. Icon credits: Waste icon created by Luis Prado and licensed under the Creative Commons Attribution from The Noun Project. Washing Machine icon created by Megan Sheehan and licensed under the Creative Commons Attribution from The Noun Project. Bucket icon created by Nithin Viswanathan and licensed under the Creative Commons Attribution from The Noun Project. Water drop icon created by Diego Naive and licensed under the Creative Commons Attribution from The Noun Project. Broom icon created by Anna Weiss and licensed under the Creative Commons Attribution from The Noun Project. Clock icon created by Pavel Nikandrov and used via a Public Domain Mark from The Noun Project. Sprinkler icon created by Micah West and licensed under the Creative Commons Attribution from The Noun Project. Cactus icon created by Edward Boatman and licensed under the Creative Commons Attribution from The Noun Project. Shower icon used via a Public Domain Mark from The Noun Project.
Choose a water supplier
About the data: These charts show the daily per capita residential water use rate in California as calculated by the State Water Resources Control Board. The charts cover the August 2017 reporting period, and are compared to the previous month unless specified. Since the per capita measure (which reflects gallons of water used per resident per day) does not take into account rainfall, temperature, humidity and population density, the State Water Resources Control Board discourages comparisons between water suppliers.
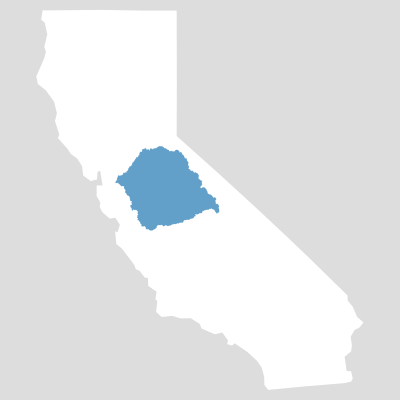
San Joaquin River
Daily per capita residential water use decreased in August 2017 to an average of 64.67 gallons for the 25 agencies in the San Joaquin River hydrologic region. That number is compared to the July 2017 daily per capita residential water use of 66.38. Use the chart below to see how the 25 agencies in this region performed. Click here to see enforcement statistics for water agencies in this region.
-
Amador Water Agency
40.60
residential gallons
used daily per capita -
Calaveras County Water District
64.90
residential gallons
used daily per capita -
California Water Service Company Stockton
48.50
residential gallons
used daily per capita -
City Of Antioch
61.30
residential gallons
used daily per capita -
City Of Atwater
86.40
residential gallons
used daily per capita -
City Of Brentwood
63.00
residential gallons
used daily per capita -
City Of Ceres
56.10
residential gallons
used daily per capita -
City Of Lathrop
45.20
residential gallons
used daily per capita -
City Of Livingston
56.80
residential gallons
used daily per capita -
City Of Lodi
61.80
residential gallons
used daily per capita -
City Of Los Banos
72.10
residential gallons
used daily per capita -
City Of Madera
59.80
residential gallons
used daily per capita -
City Of Manteca
60.10
residential gallons
used daily per capita -
City Of Merced
88.50
residential gallons
used daily per capita -
City Of Modesto
79.70
residential gallons
used daily per capita -
City Of Oakdale
74.50
residential gallons
used daily per capita -
City Of Patterson
30.30
residential gallons
used daily per capita -
City Of Ripon
75.30
residential gallons
used daily per capita -
City Of Stockton
56.60
residential gallons
used daily per capita -
City Of Tracy
70.80
residential gallons
used daily per capita -
City Of Turlock
76.00
residential gallons
used daily per capita -
Diablo Water District
52.20
residential gallons
used daily per capita -
Discovery Bay Community Services District
86.50
residential gallons
used daily per capita -
Groveland Community Services District
78.10
residential gallons
used daily per capita -
Tuolumne Utilities District
61.00
residential gallons
used daily per capita -
Min
30.30 -
Median
63.00 -
Average
64.67 -
Max
88.50